


What Happened to Mikael Granlund in Pittsburgh? Revisiting His Penguins Struggles After a Stars Hat Trick
After a frustrating stint in Pittsburgh and a holding pattern in San Jose, Granlund is playing a crucial role on a Stanley Cup contender

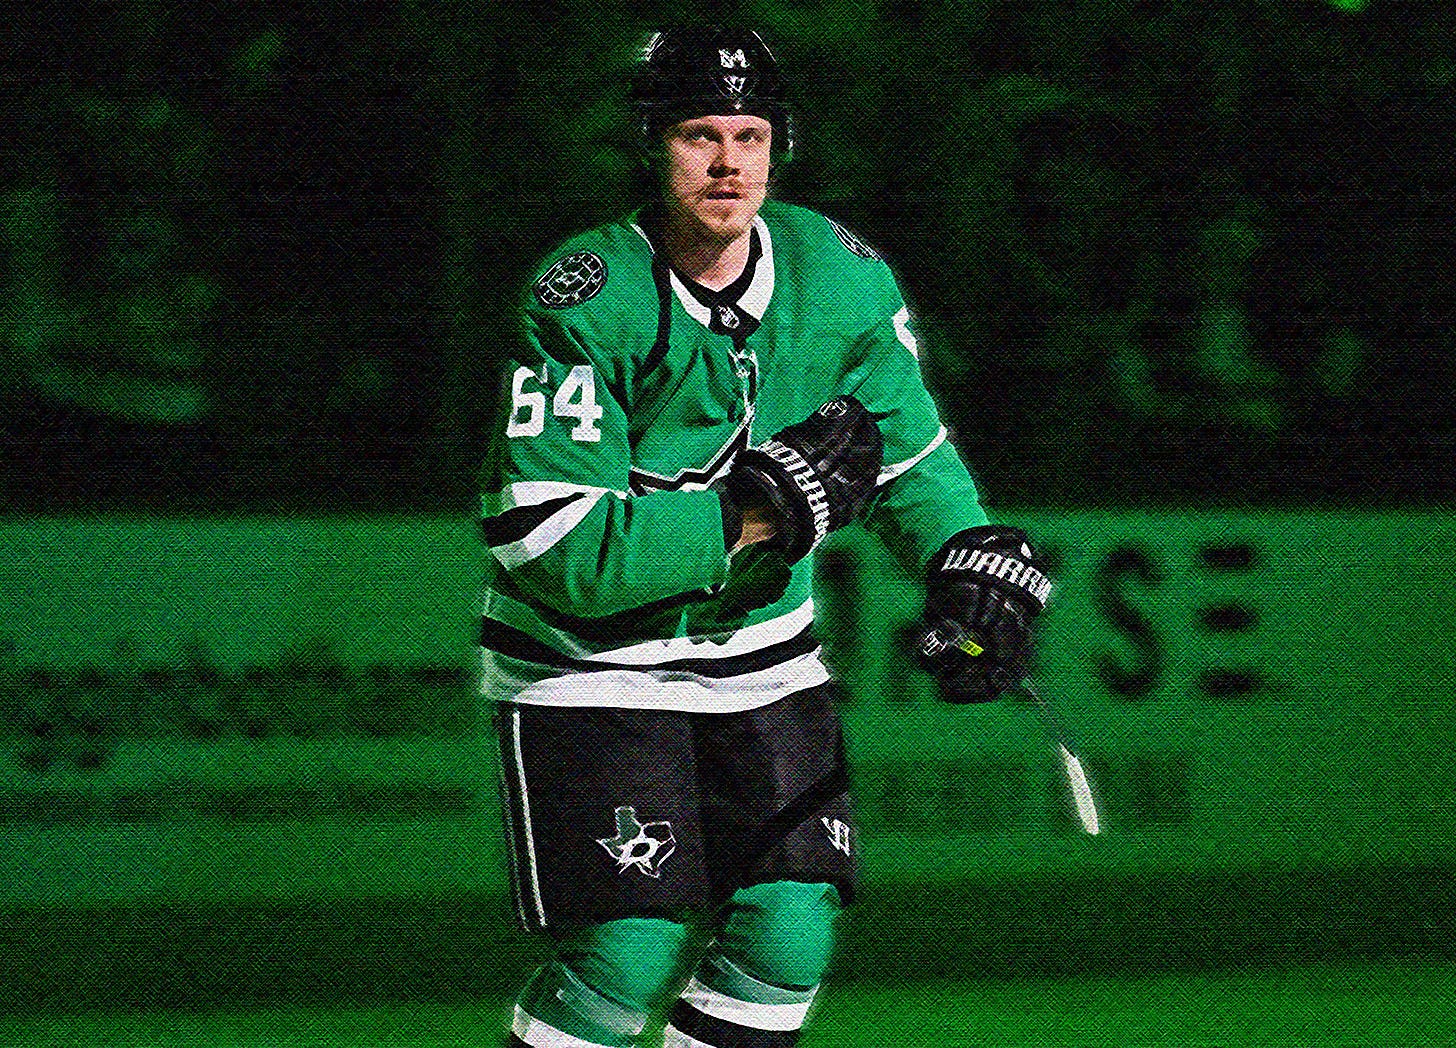
The average NHL player’s career is four and a half season. An upper quartile NHL career is 12 seasons. To last 13 seasons and log 70 playoff games next to your name is nothing to sneeze at. In the case of Dallas Stars forward Mikael Granlund, his career is a unique case study in how environments impact non-superstar players. For much of Granlund’s NHL career, he’s been a top-six staple and ridden with quality players like Zach Parise and Matt Duchene.
But, for a brief 21 game stint during the 2022-2023 NHL season, Granlund endured the worst stretch of his professional career as a member of the flailing Pittsburgh Penguins. After a 2021-2022 season that ended in a game seven overtime loss to the New York Rangers, in a series that Pittsburgh was in control of, the Penguins were still in the playoff mix the following March.
On March 1st of 2023, the day Granlund was traded to Pittsburgh, the Penguins occupied the final playoff spot in the Eastern Conference with 69 standings points. Then general manager Ron Hextall’s team sat three points clear of the next two closest teams which were the Buffalo Sabres and Florida Panthers.
The Panthers would run down the Penguins over the season’s final month and ever since then, the two organizations have gone in opposite directions. The Panthers improbably made the Stanley Cup final as an eight seed, rattling off three straight series upset wins, including knocking off the best regular season team of all time, the Boston Bruins and their 135 standings points in the first round.
Pittsburgh would miss the postseason for the first time since the 2005-2006 season and they haven’t been back since. Over the course of Granlund’s brief tenure with the Penguins, the team went 10-10-2 and their opponents outscored them 73-67. Not a horrendous run by any means, but enough for the Panthers to leapfrog them with a 12--6-2 record.
Now, this edition of We’re So Back sports is here to answer one question AllPhly.com sports writer, Charlie O’Connor asked Tuesday night after Granlund’s hat trick:

Thankfully, with 13 NHL seasons under Granlund’s belt, it shouldn’t be too hard to identify what so so horrendously wrong in Pittsburgh.
Player Usage
Generally speaking, whenever trying to understand a player’s counting stat production, there is no stronger driver than ice time. You have to be on the ice to score, the more often a player plays, the more likely they are to have earned a featured lineup role, better line mates and the opportunity to feature on a special teams unit.
In the case of Granlund, his ice time took a discernible hit over the course of the entirety of the 2022-2023 season, not just his time with the Penguins. In his 21 game stint in the Steel City, Granlund averaged a shade under 16 minutes per game, nearly a full 2 minutes less than his workload as a Predator in just that season alone.
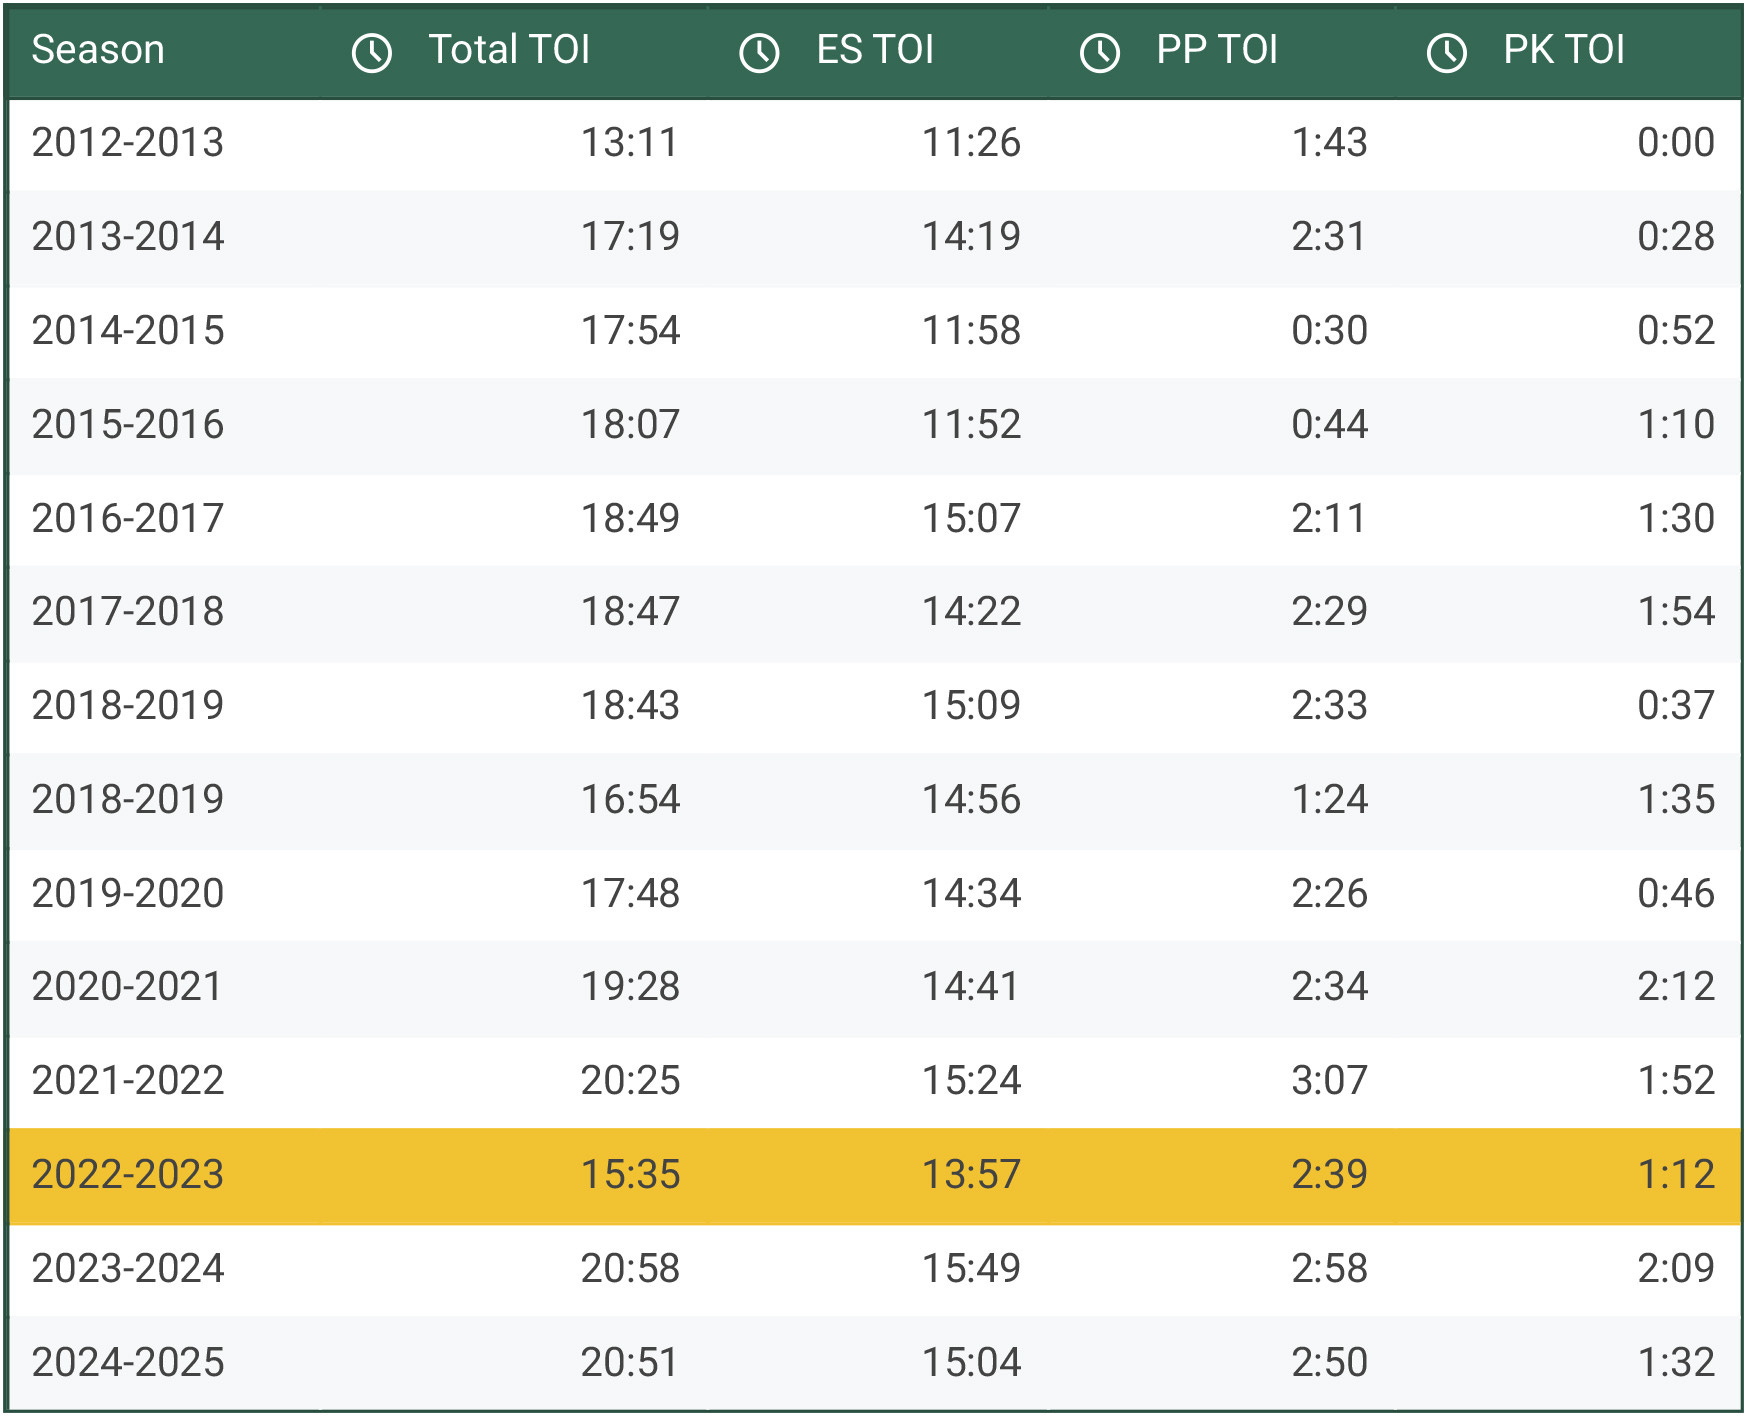
In the aggregate of the stops combined, you’ll notice a five full minute dip in all situations in comparison to the previous and each of the two subsequent seasons. Since Granlund was getting less ice time, there was materially less hockey for him to impact, especially a 30 second decrease in power play time. While 30 seconds might not seem like a lot, teams are almost 30% more likely to score in man advantage situations than even strength ones.
After addressing his opportunity to just get out on the ice, the next component in evaluating environmental factors is line mates. If a player takes a noticeable dip in ice time, it’s natural to assume they’re playing lower in the line up which means more limited skillsets in the personnel they play with.
Other than perhaps the 2020-2021 season in Nashville, I don’t think it’s a stretch to say that Granlund’s most common line mates during his time in Pittsburgh were the most limited of his entire career. Danton Heinen and Ryan Poehling have a combined 139 goals in 849 career NHL games, which roughly averages out to .16 goals per game for their respective careers.
While Granlund doesn’t light the lamp a whole lot himself, going from playing with Matt Duchene and Filip Forsberg to Hextall’s misfit toys third line was a massive drop off in facilitating talent. The Finn isn’t the most explosive or dynamic piece, but his career track record of solid output (.67 points per game) show a player that can compliment more high-end players.
After considering time on ice and quality of line mates, it’s time to consider quality of competition. The assumption being that if Granlund is playing less per game and with more limited line mates, he would likely be drawing easier assignments to try and mitigate those factors.
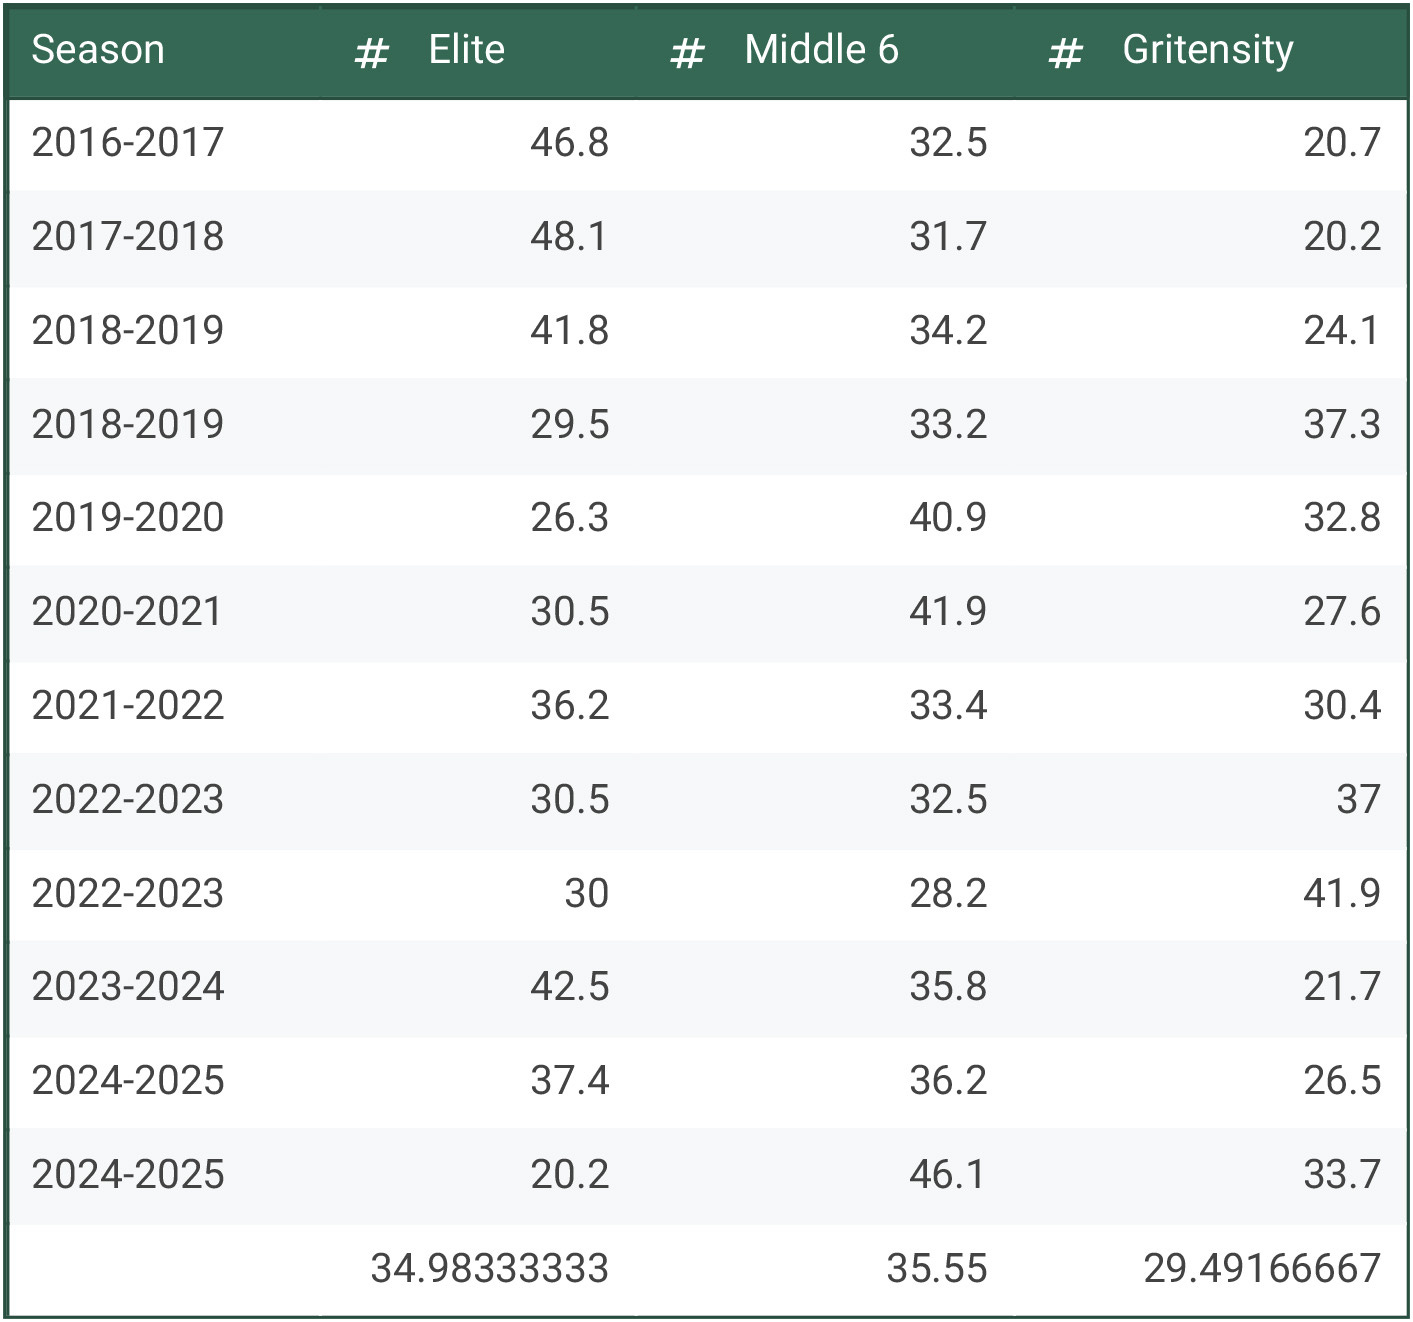
In fact there’s been no stretch of Granlund’s career where he was deployed against fourth line caliber players than his 21 games as a Penguin. When you add up the ice time reduction, skillset of Granlund’s line mates it does make sense that he was frequently drawing easier matchups as a means of swinging the game in Pittsburgh’s favor because of his career profile.
Contextually, the environment for Granlund was rough in Pittsburgh. He was playing in a more niche lineup role on a depth line. If Granlund had been deployed alongside Sidney Crosby or Evgeni Malkin, it would’ve been reasonable to expect more counting stats wise than what he ultimately netted.
How the sausage is made
When it comes to measuring player output, it’s pretty easy to get a profile on their impact through shot metrics. Whichever database you prefer, Natural Stat Trick, Evolving Wild or Money Puck all reasonably do the job of painting the picture. The trick here is to combine these shot metrics with the context of section one and the following section on transition play to put it all together.
In any player evaluation, think of counting stats as the bones, contextual considerations as muscles and the transition play as ligaments and tendons. Separate from each other, they’re incapable of completing goals, together, you have a well rounded picture that can explain most runs of form.
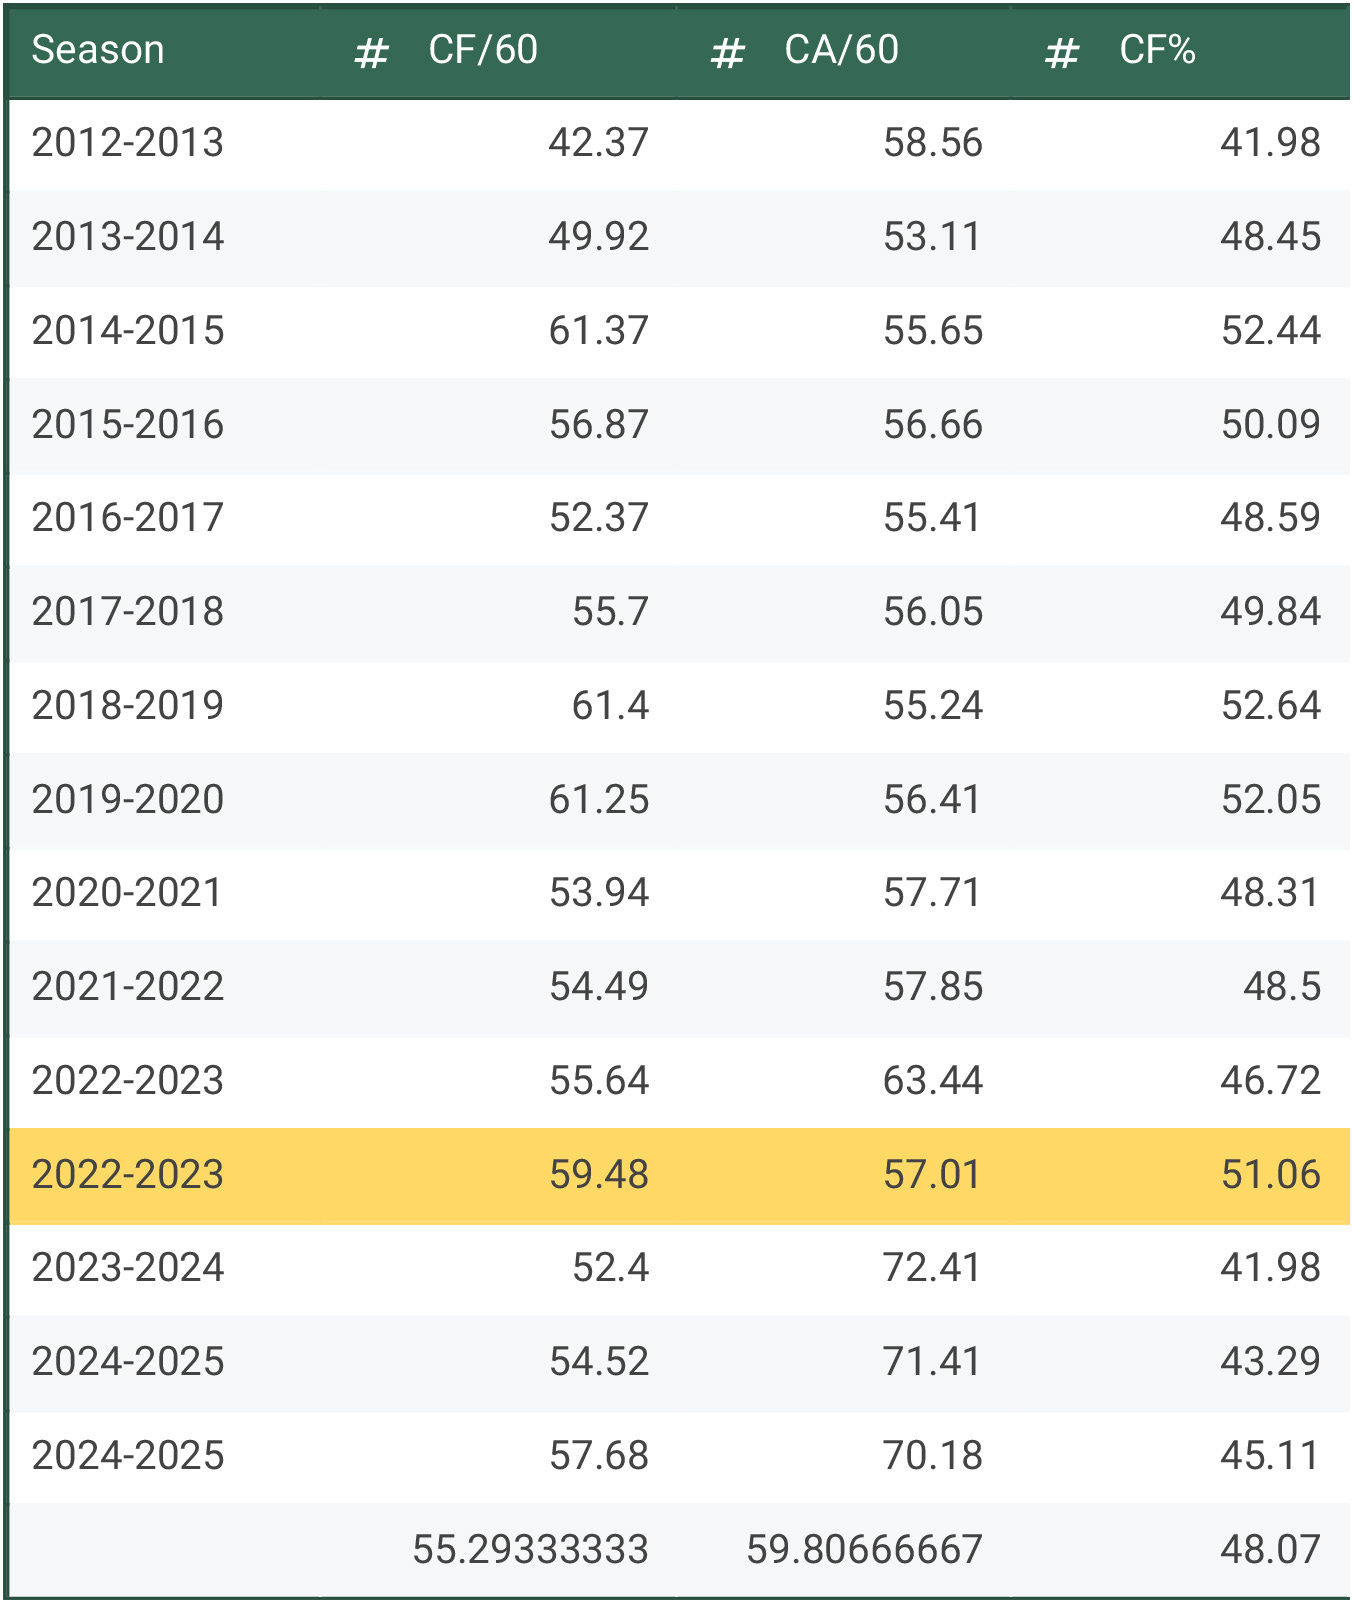
The first step in building out a shot metric profile is understanding offensive possession. Chances for (CF) and chances against (CA) are simply measures of a team and its opponent’s scoring chances. A scoring chance is either a goal, shot on goal, missed shot or blocked shot. If a team has a greater share of scoring chances, they would be assumed to have more puck possession to create those chances.
Granlund’s 21 games as a Penguin aren’t all that dissimilar from his career averages. In fact, Pittsburgh had more scoring chances per 60 minutes of ice time when the Finn was on the ice than his career average for those 21 games and had a greater than 50 percent share of scoring chances meaning that the Penguins were in the offensive zone a good chunk of the time.
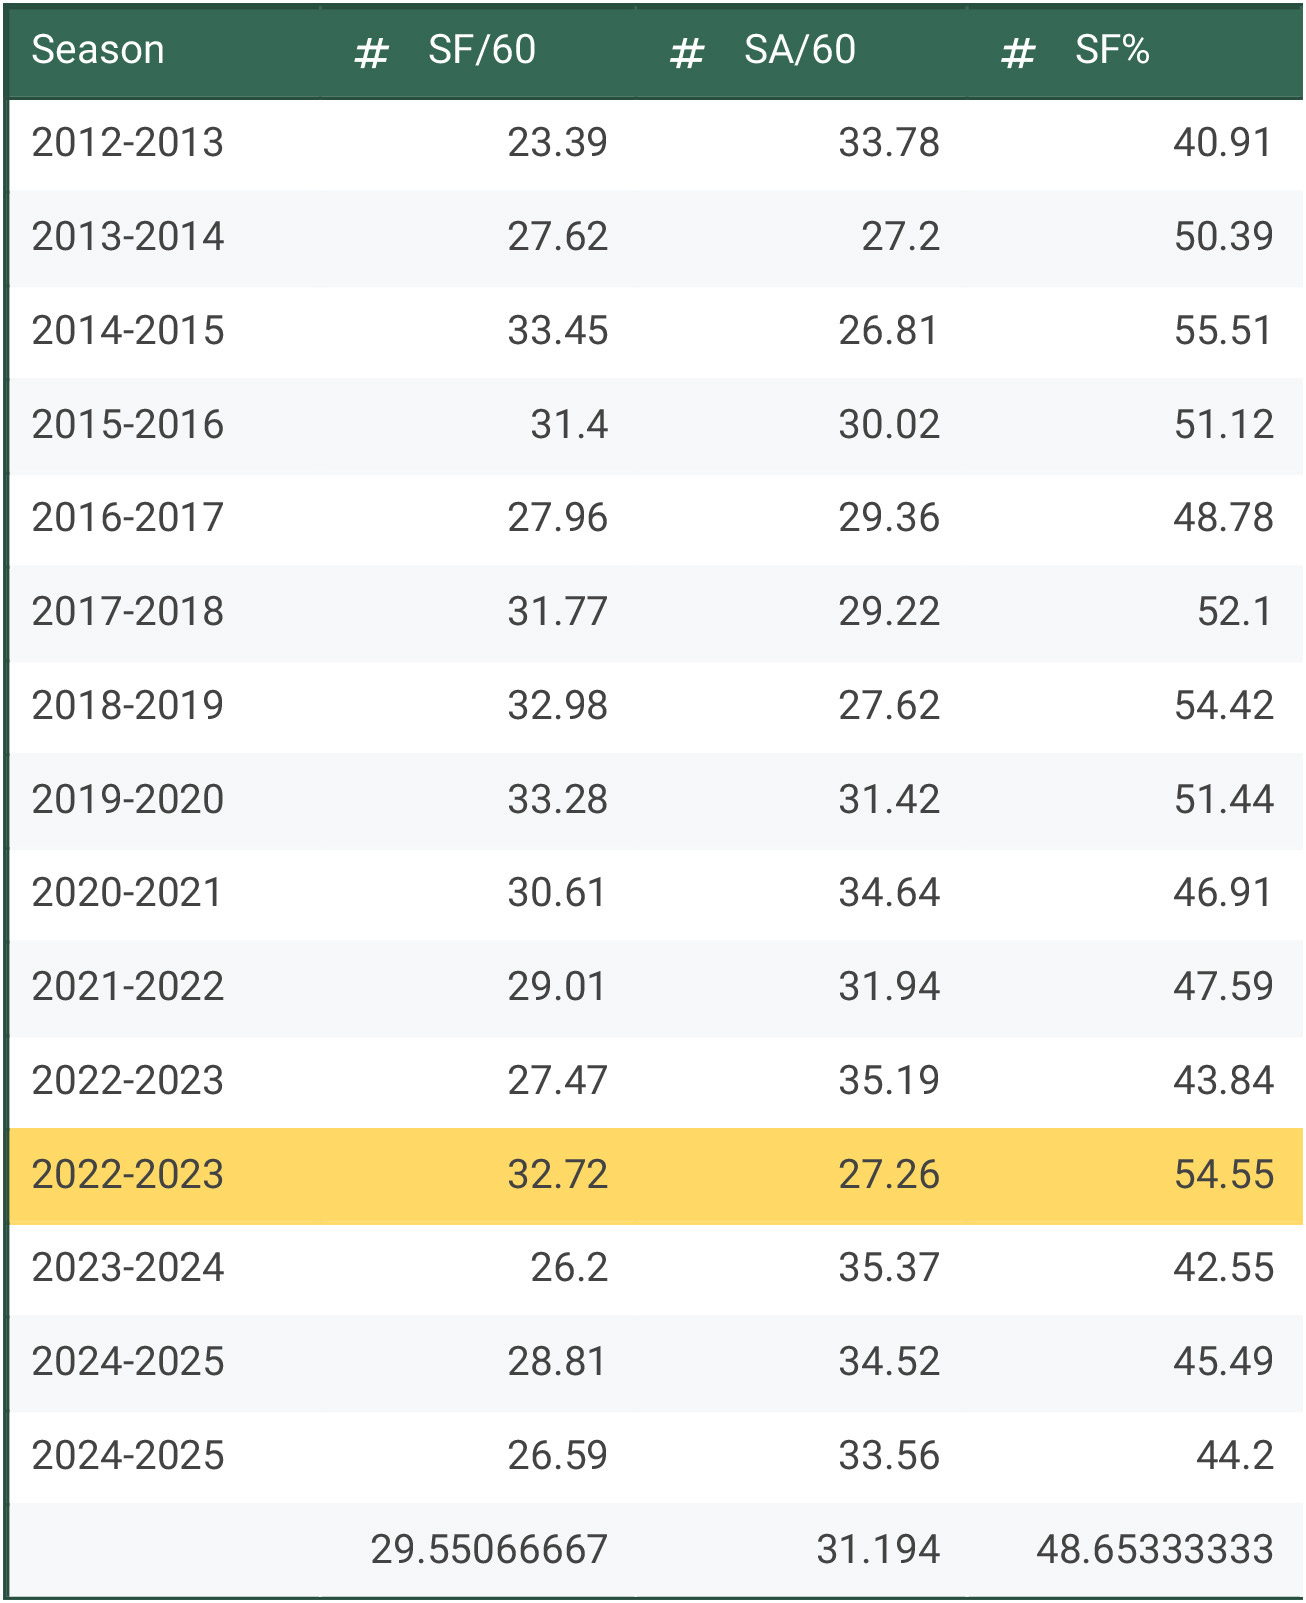
Building upon scoring chances is shots on goal. Note the distinction between the two, where shots on goal only counts goals and shots on goal, not blocks, posts or missed shots. Granlund is still in good shape here, not only were the Penguins getting offensive zone time, they were getting the puck on net. It’s not uncommon for team’s depth lines to focus on junk offense centered around holding the offensive zone for extended periods of time as a means of slowing the tempo of the game down and taking pressure off of their defense.
Having nearly 55 percent of the shot share is pretty impressive in terms of holding offensive zone time. But, it doesn’t account for the quality of the offense the Penguins generated in Granlund’s minutes. Empty volume is a good way to slow the game and work towards eventually wearing down the defense and goaltending, but it is not particularly efficient.
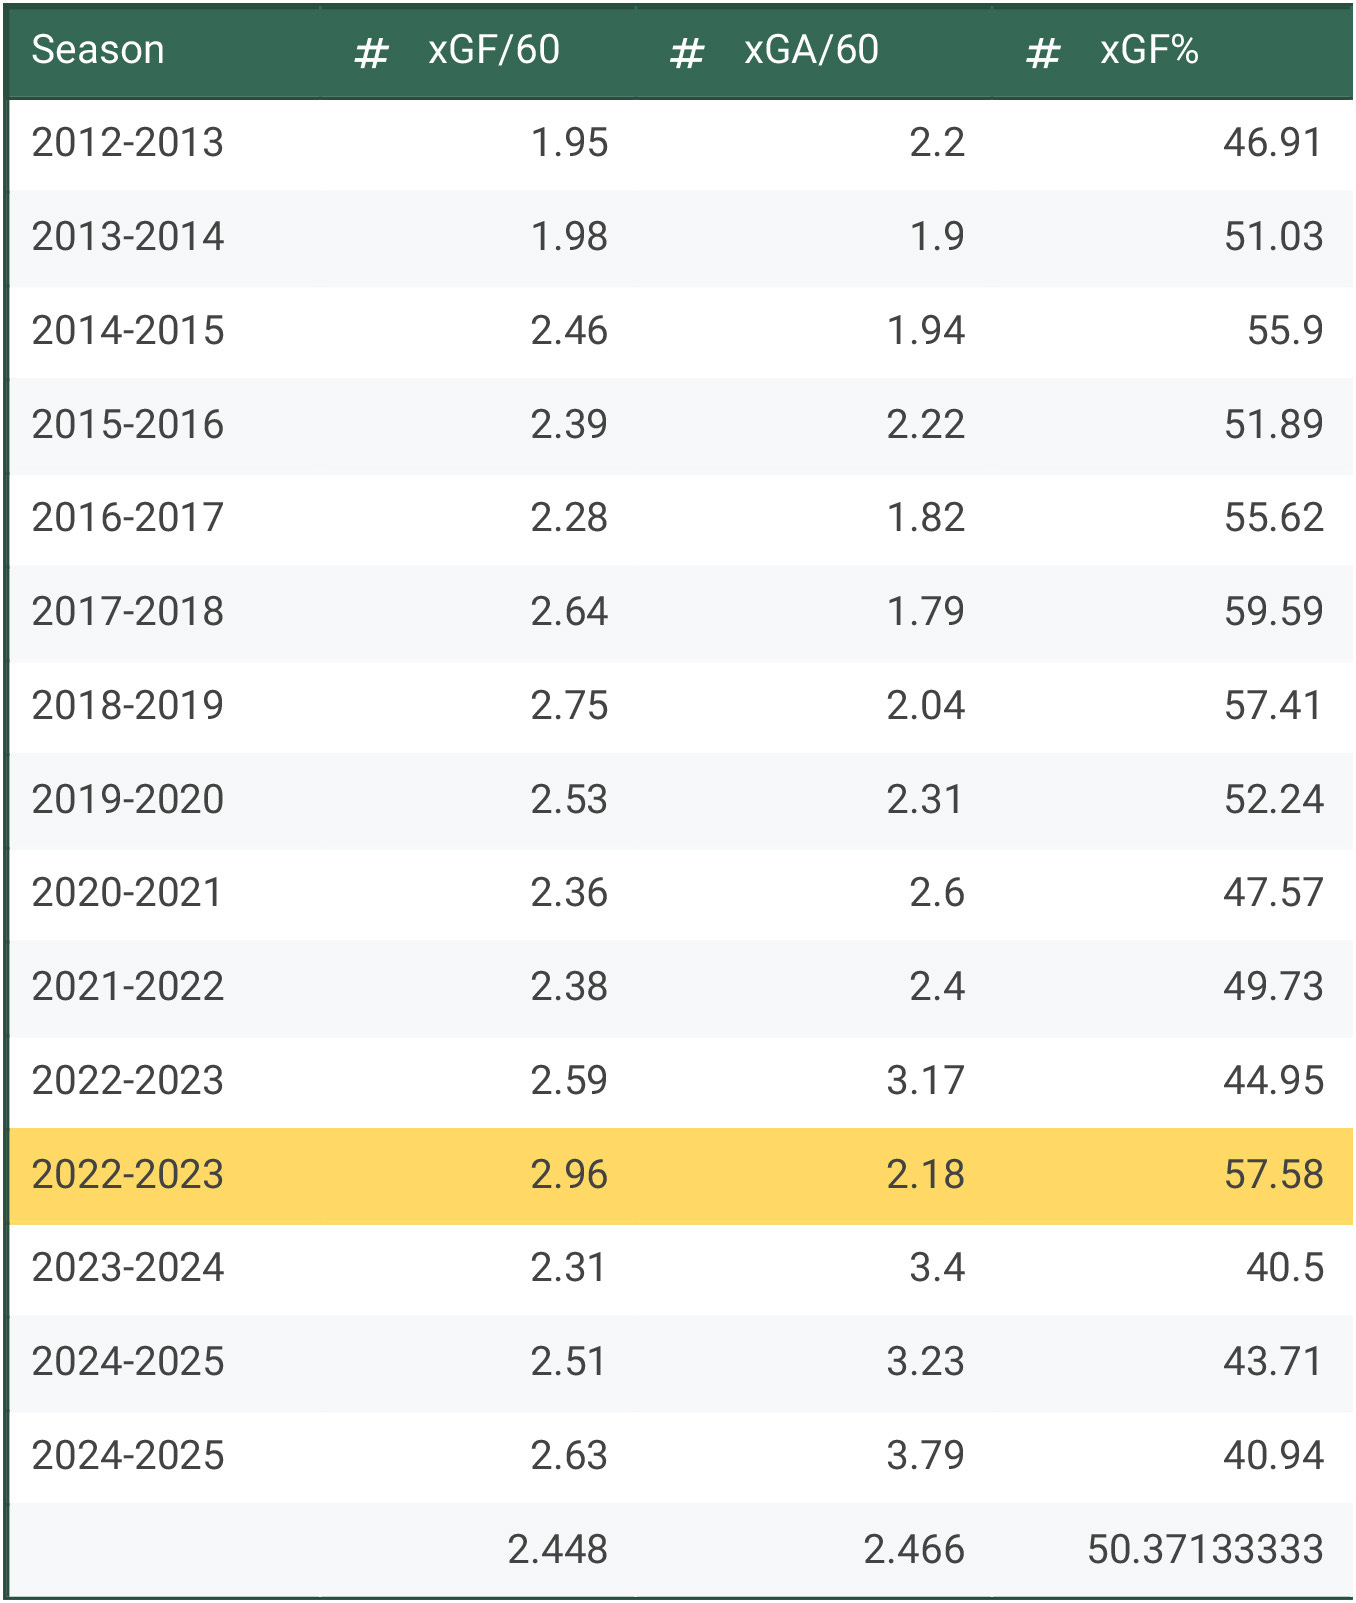
Now with some depth to the scoring chance numbers, it’s also clear that in Granlund’s limited playing time, the Penguins were actually creating some dangerous offense. Expected goals is calculated using historical shot tracking data. Each individual scoring chance is assigned a value between zero and 1 based on how often scoring chances from that location have gone in in the past. The more likely a scoring chance is to result in a goal, the higher the expected goals value.
As the highlighted column of the table shows, the Penguins were creating dangerous offense in Granlund’s minutes. Adding up the first two prongs of this evaluation, Pittsburgh was outplaying its opponents, they had the puck more often and were creating chances that were more likely to lead to goals than their opponents.
Adding an additional layer to the expected goals conversation, high danger chances are defined as those most likely to go in. The high danger area of the ice is defined as the immediate area around the net front as visualized below.

So, naturally, with Granlund’s underlying numbers all checking out as the Penguins being in control during his minutes, it raises a straightforward question: What the hell actually happened? It’s surreal to a see a player with a documented track record of success at the NHL level struggle to this degree especially with the statistics bearing out that the Penguins were winning his minutes.
This of course brings us to the most fickle of mistress, shooting luck.
While Granlund and his line mates on-ice shooting percentage is on the lower end of his range of outcomes, it’s not impossibly bad. It’s not as if they were shooting one or two percent.
Team On-Ice Shooting Percentage is an advanced statistic in hockey that measures the percentage of a team's shots on goal that result in goals while a specific player or group of players is on the ice
What it all means
A certain caliber of player has the capacity to outplay their environmental and circumstantial factors. When Granlund’s present day teammate with the Stars Mikko Rantanen is outshot 72-86 over the course of 175 minutes at 5-on-5 he has the physical tools to make the fewer opportunities he would have more valuable than what the average player is capable of.
For someone like Granlund who’s always been a bit more of a Robin than a Batman, a slight cold run of shooting luck in conjunction with a reduction in ice time, more limited skillset line mates, playing lower in the lineup where the expectation for the line is to slow the game down and not get bludgeoned, it was all too much to overcome.
Clearly since leaving Pittsburgh for San Jose and being traded to Dallas, Granlund has found better opportunities to operate. He’s a functional hockey player with some lineup utility that serves as a nice compliment to high-end stars. As the wingman to the aforementioned Finnish terminator, Rantanen, and Roope Hintz one of the best transition centers in the entire NHL, the Stars are outscoring opponents 8-2 at 5-on-5 with Granlund on the ice over 105 minutes.
The outlier sample from Granlund’s brief stint in Pittsburgh is just a fascinating case study in the interaction of talent and environment. Either way, Granlund has found a great fit amongst several of his Finnish national team teammates and its brought more out of his game than expected upon his acquistion from the Sharks.
But to answer O’Connor’s initial Tweet that inspired this entire edition of the Newsletter? A perfect storm of bad situational circumstances all compounded together. If you’d like to buy into the official narrative from Penguins’ fans on social media, Granlund separated from his wife that spring before eventually finalizing a divorce in the offseason.
The data though shows a player who was an active facilitator of offensive zone time and got the puck to dangerous areas of the ice. The puck just didn’t go in the net.
Of course, that’s not a problem in Dallas who hasn’t seen this many gifted shooters since November 22, 1963.